

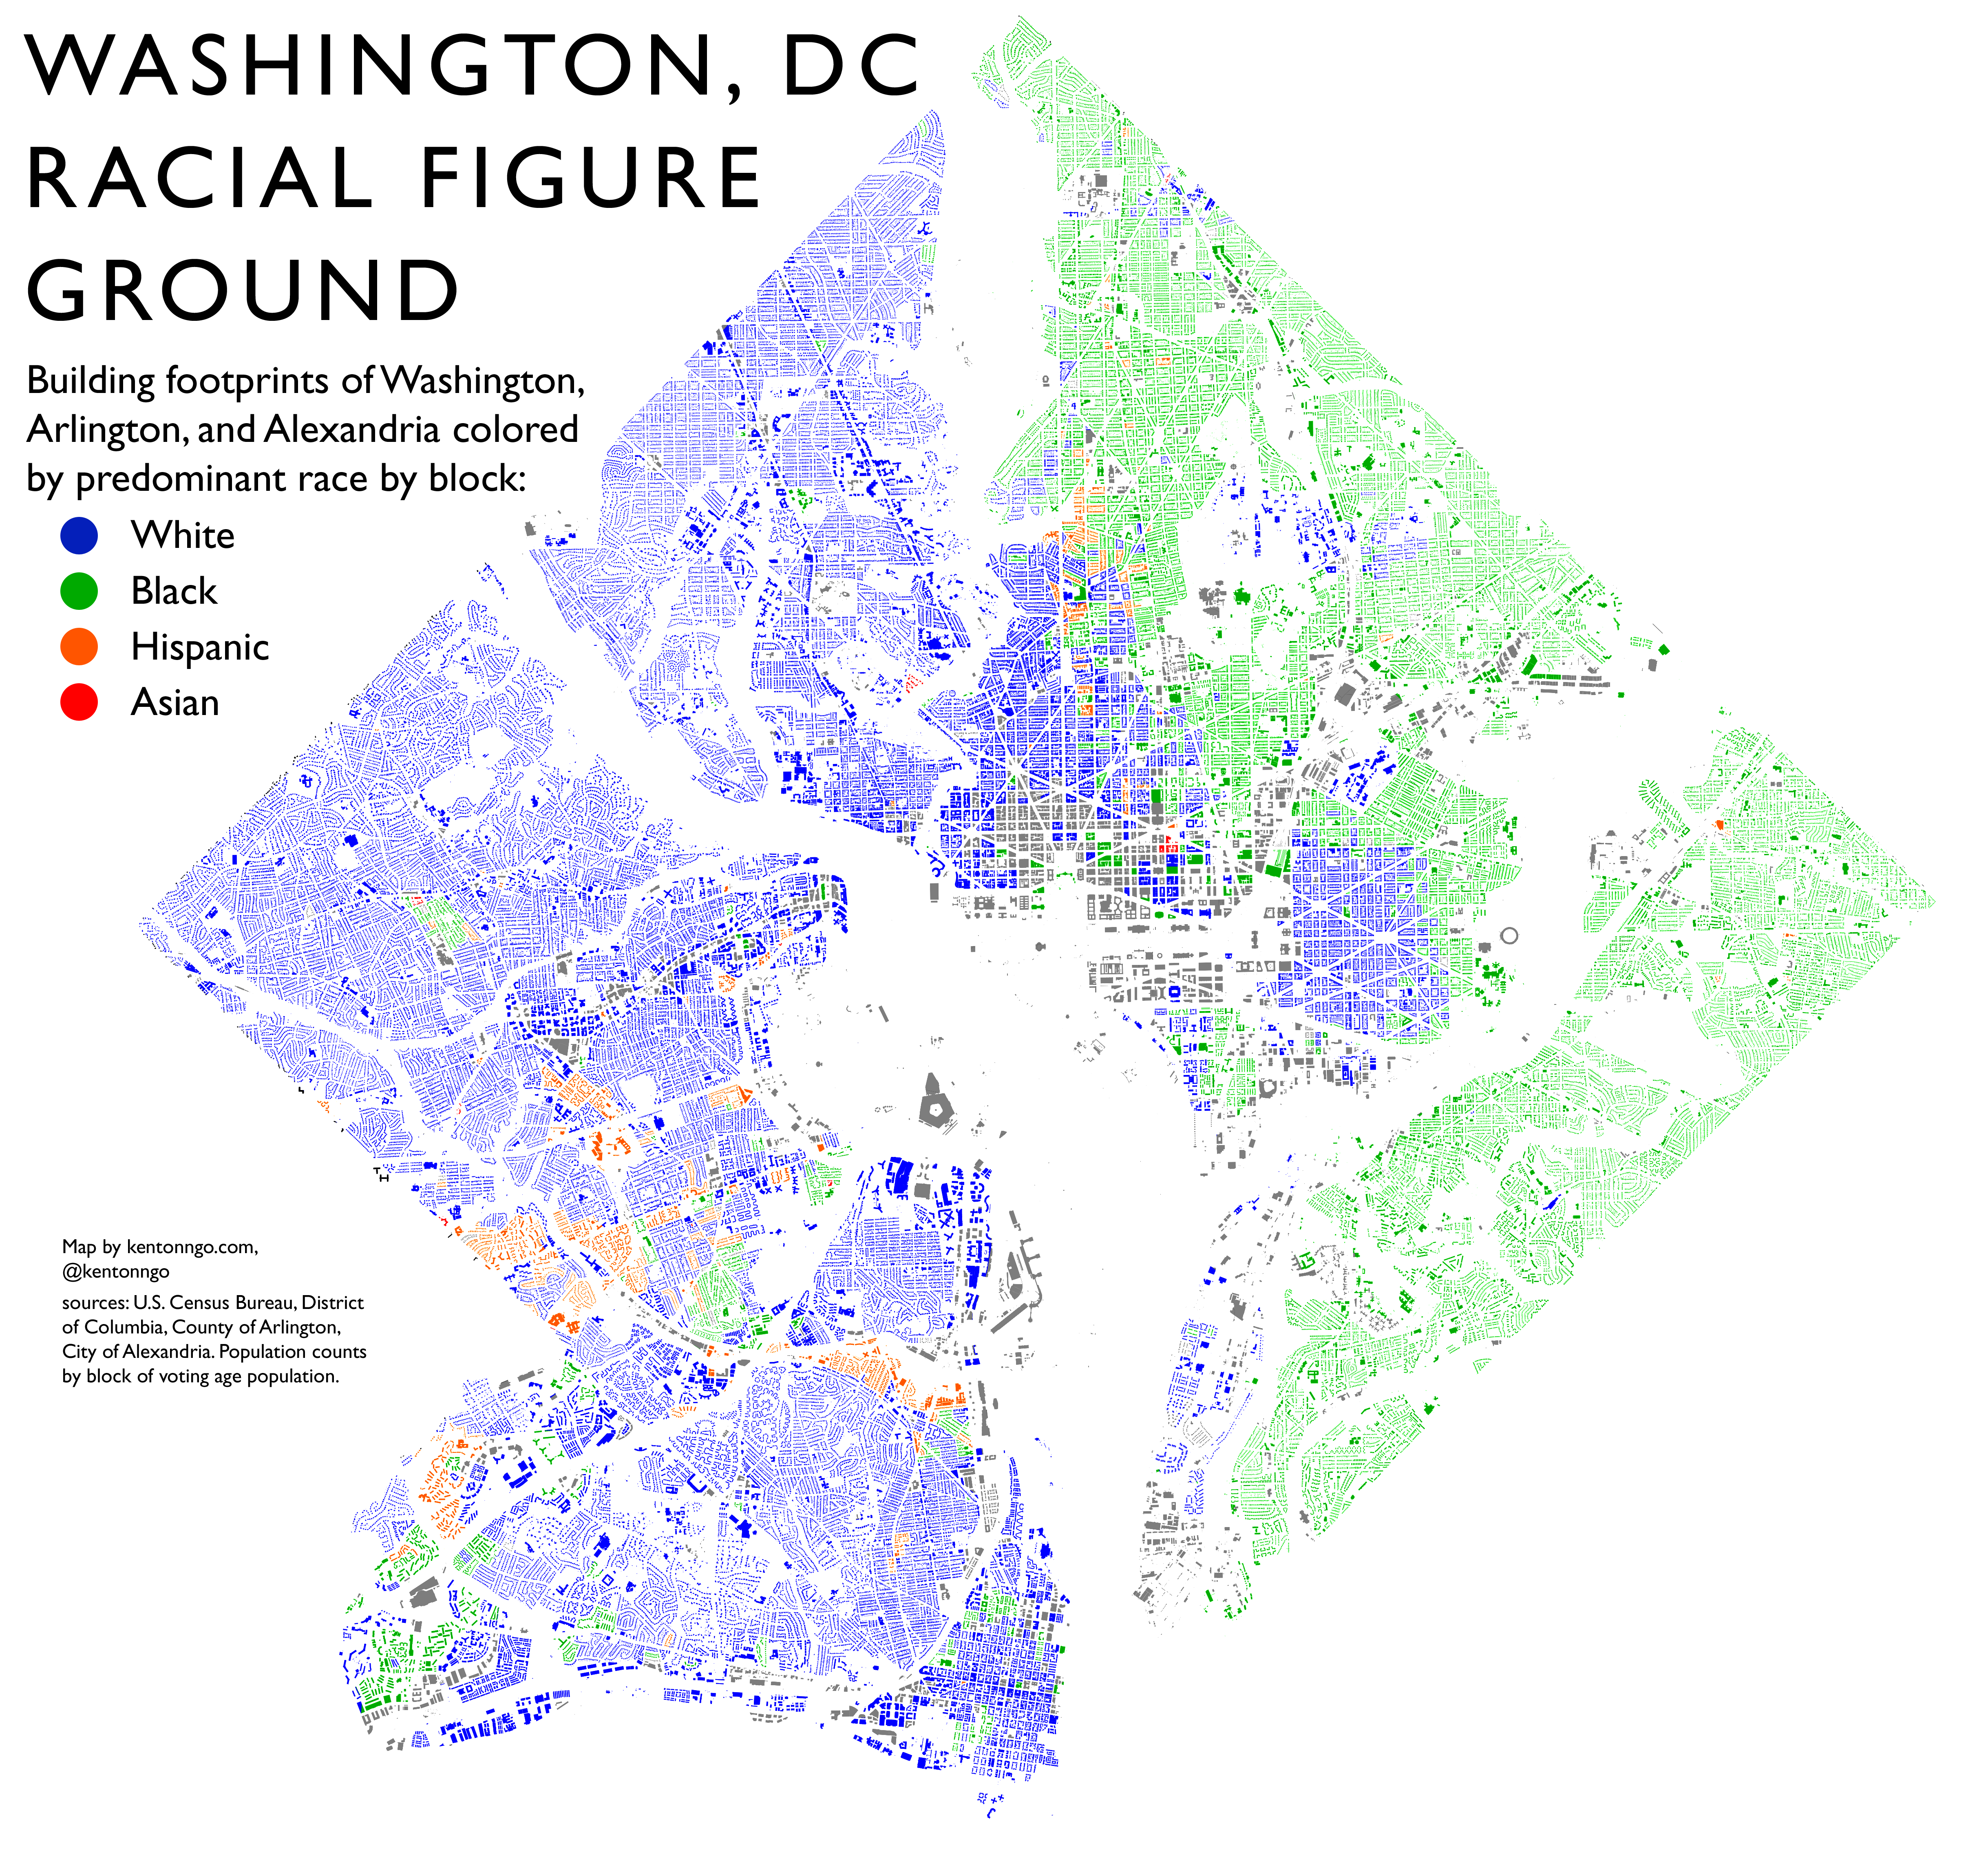
This map shows building footprints of Washington, DC, Arlington, VA, and Alexandria, VA, which together cover what used to be the ten miles square of the original District of Columbia. Each census block is colored in by its predominant race. Some of the gray areas are unpopulated office or landmark buildings that you’ll likely recognize, like the Pentagon.
I think of it as a new twist on race dot maps (popularized by Bill Rankin) that are constrained to the actual buildings people might live in. The physical separations of neighborhoods, set by rivers and highways and railroads, show as gaps, along with more subtle divisions: where city grids and blocks give way to meandering suburbs.
The flaw with this map is that it shows dominance over diversity. Farther out in the suburbs racial neighborhood divisions are less sharp.
For this map I used QGIS, and blended a layer of census blocks colored by race onto publicly available building footprint shapefiles from local governments, a relatively new feature. This was much faster than running a spatial join to create a new shapefile of buildings assigned by block.
Open Data Portals – Alexandria – Arlington – District of Columbia
One Comment