Virginia Senator Mark Warner (D) is the face of a dying breed — the Democrat who could win Southwest Virginia.
Last Tuesday, former Republican National Committee chair Ed Gillespie was unable to take the Senate seat from Warner, but Gillespie was able to wipe out Warner Country.
The signs have been there for over two decades.
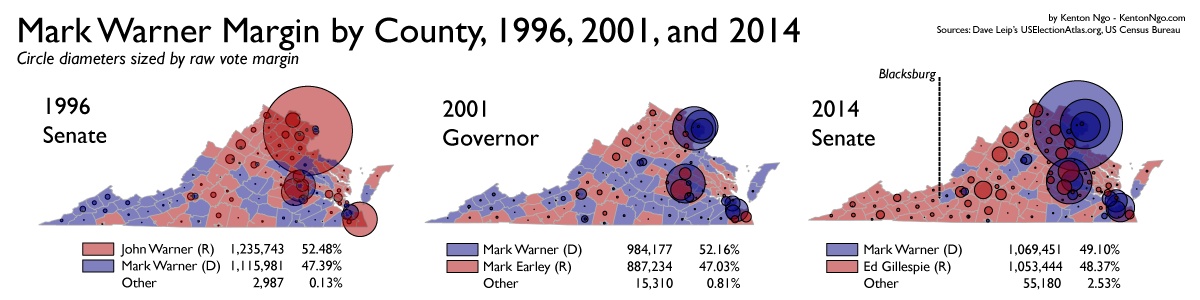
The course of partisan realignment in Virginia’s last 20 years could be charted through the electoral fortunes of Mark Warner, a Northern Virginia cell phone millionaire that could draw support among working-class whites. In his first Senate race in 1996 against incumbent Senator John Warner (the year of “Mark Not John” bumper stickers), Mark Warner outperformed in rural areas but met his end in vote-rich Fairfax County near Washington, DC, where he lost by over 50,000 votes.
Southwest Virginia’s New Deal coalition was still holding together at the close of the 20th century. Where Democrats relied on rural black voters to narrow the margins in rural areas east of Appalachia, the Scots-Irish of Southwest Virginia celebrated by Senator Jim Webb predominated in the mountains. Every single Democratic candidate for President between 1932 and 2004, with the exception of George McGovern, carried coal-rich Buchanan County, with the help of organized labor. But as the older generation, still loyal to the party of FDR and LBJ, began to pass away, fewer and fewer of their offspring chose to stay in Southwest Virginia, and those that remained did not inherit their partisanship.
In 2001, Mark Warner ran for Governor, airing a minute-long bluegrass campaign jingle imploring the “people of the mountains at the end of their rope” to “vote in this election to keep our children home”.
Mark Warner, the hero of the hills…
Warner won handily in 2001 with a coalition of black voters, middle-class suburbanites, and Southwest Virginia, but the cracks of the New Deal coalition in Southwest Virginia were already showing at other levels. Republicans had taken control of the Virginia House of Delegates in 1999, which allowed them to draw new lines for the 2001 elections. That year, Democrats lost 4 seats from the region in the Virginia House of Delegates — 1 to population loss through redistricting, and 3 to Republican replacements. This was only an intermediate stop in a long, slow decline for Democrats from Roanoke and Martinsville on west.
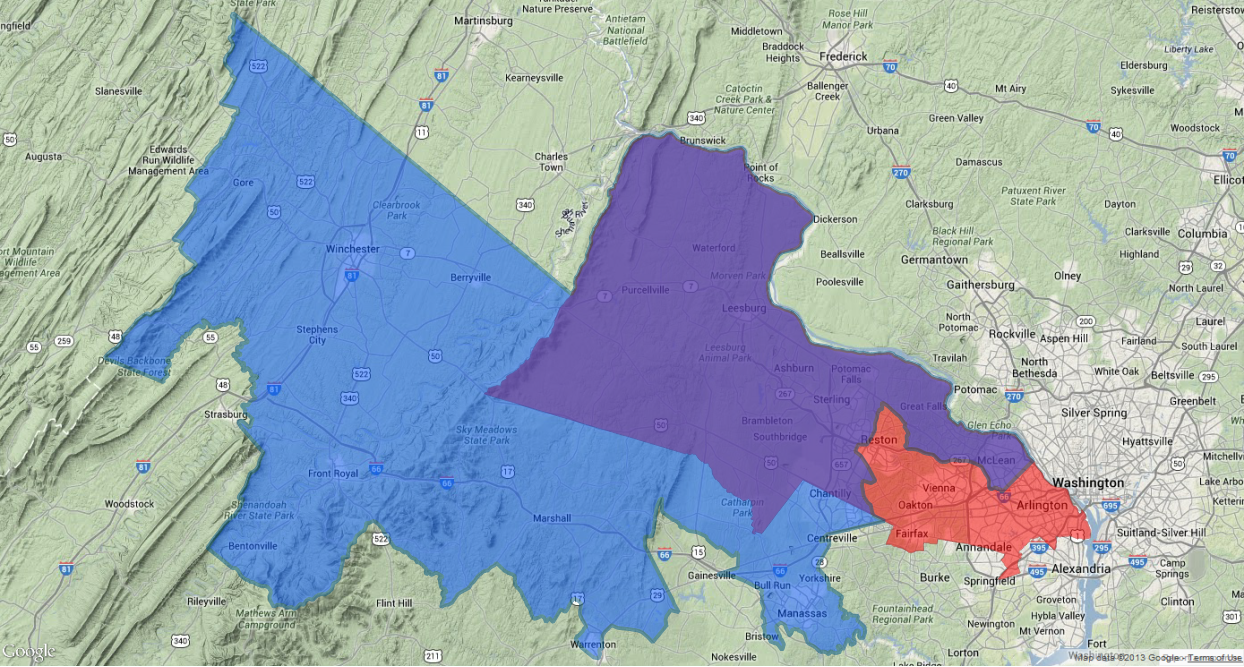
In 1992, Democrats held 14 of 16 Southwest Virginia seats in the House of Delegates. Today, they hold only 1 of 13, with Delegate Sam Rasoul of Roanoke holding onto the last seat, and a total of three seats gone to the winds of redistricting, pulled out by explosive population growth in the Northern Virginia suburbs, and pushed out by sluggish growth and decline in Southwest. With local offices serving as the bench for the Democratic team, an increasingly urban party is reliant on increasingly urban recruits.
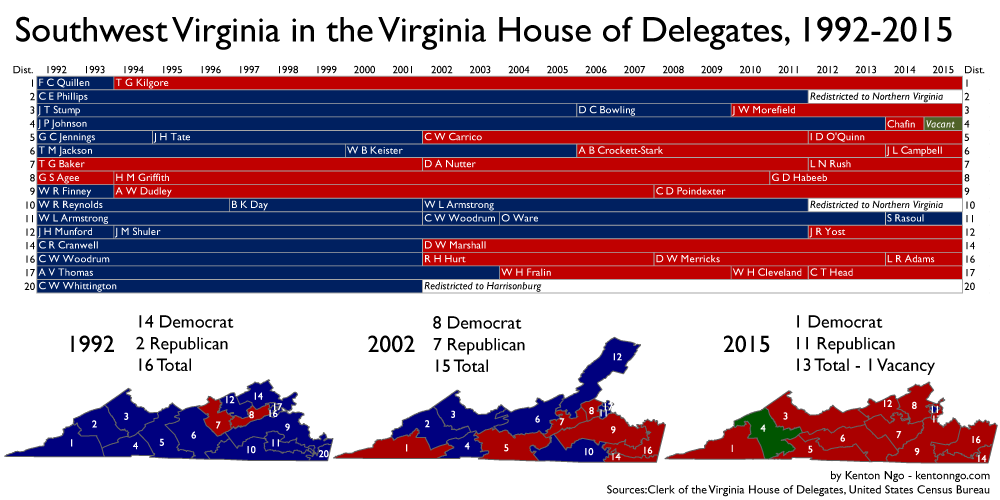
One seat, the 4th District, is currently vacant, as Delegate Ben Chafin was promoted to the State Senate, replacing State Sen. Phil Puckett (last seen under investigation for possibly trading a resignation for a job and daughter’s judgeship, a scandal that Mark Warner managed to get entangled in).
Sam Rasoul is not the only one who could begin their bio with “The last Democrat in Southwest Virginia” in their chamber. State Sen. John Edwards is now the last Democrat in Virginia’s upper chamber from the region.
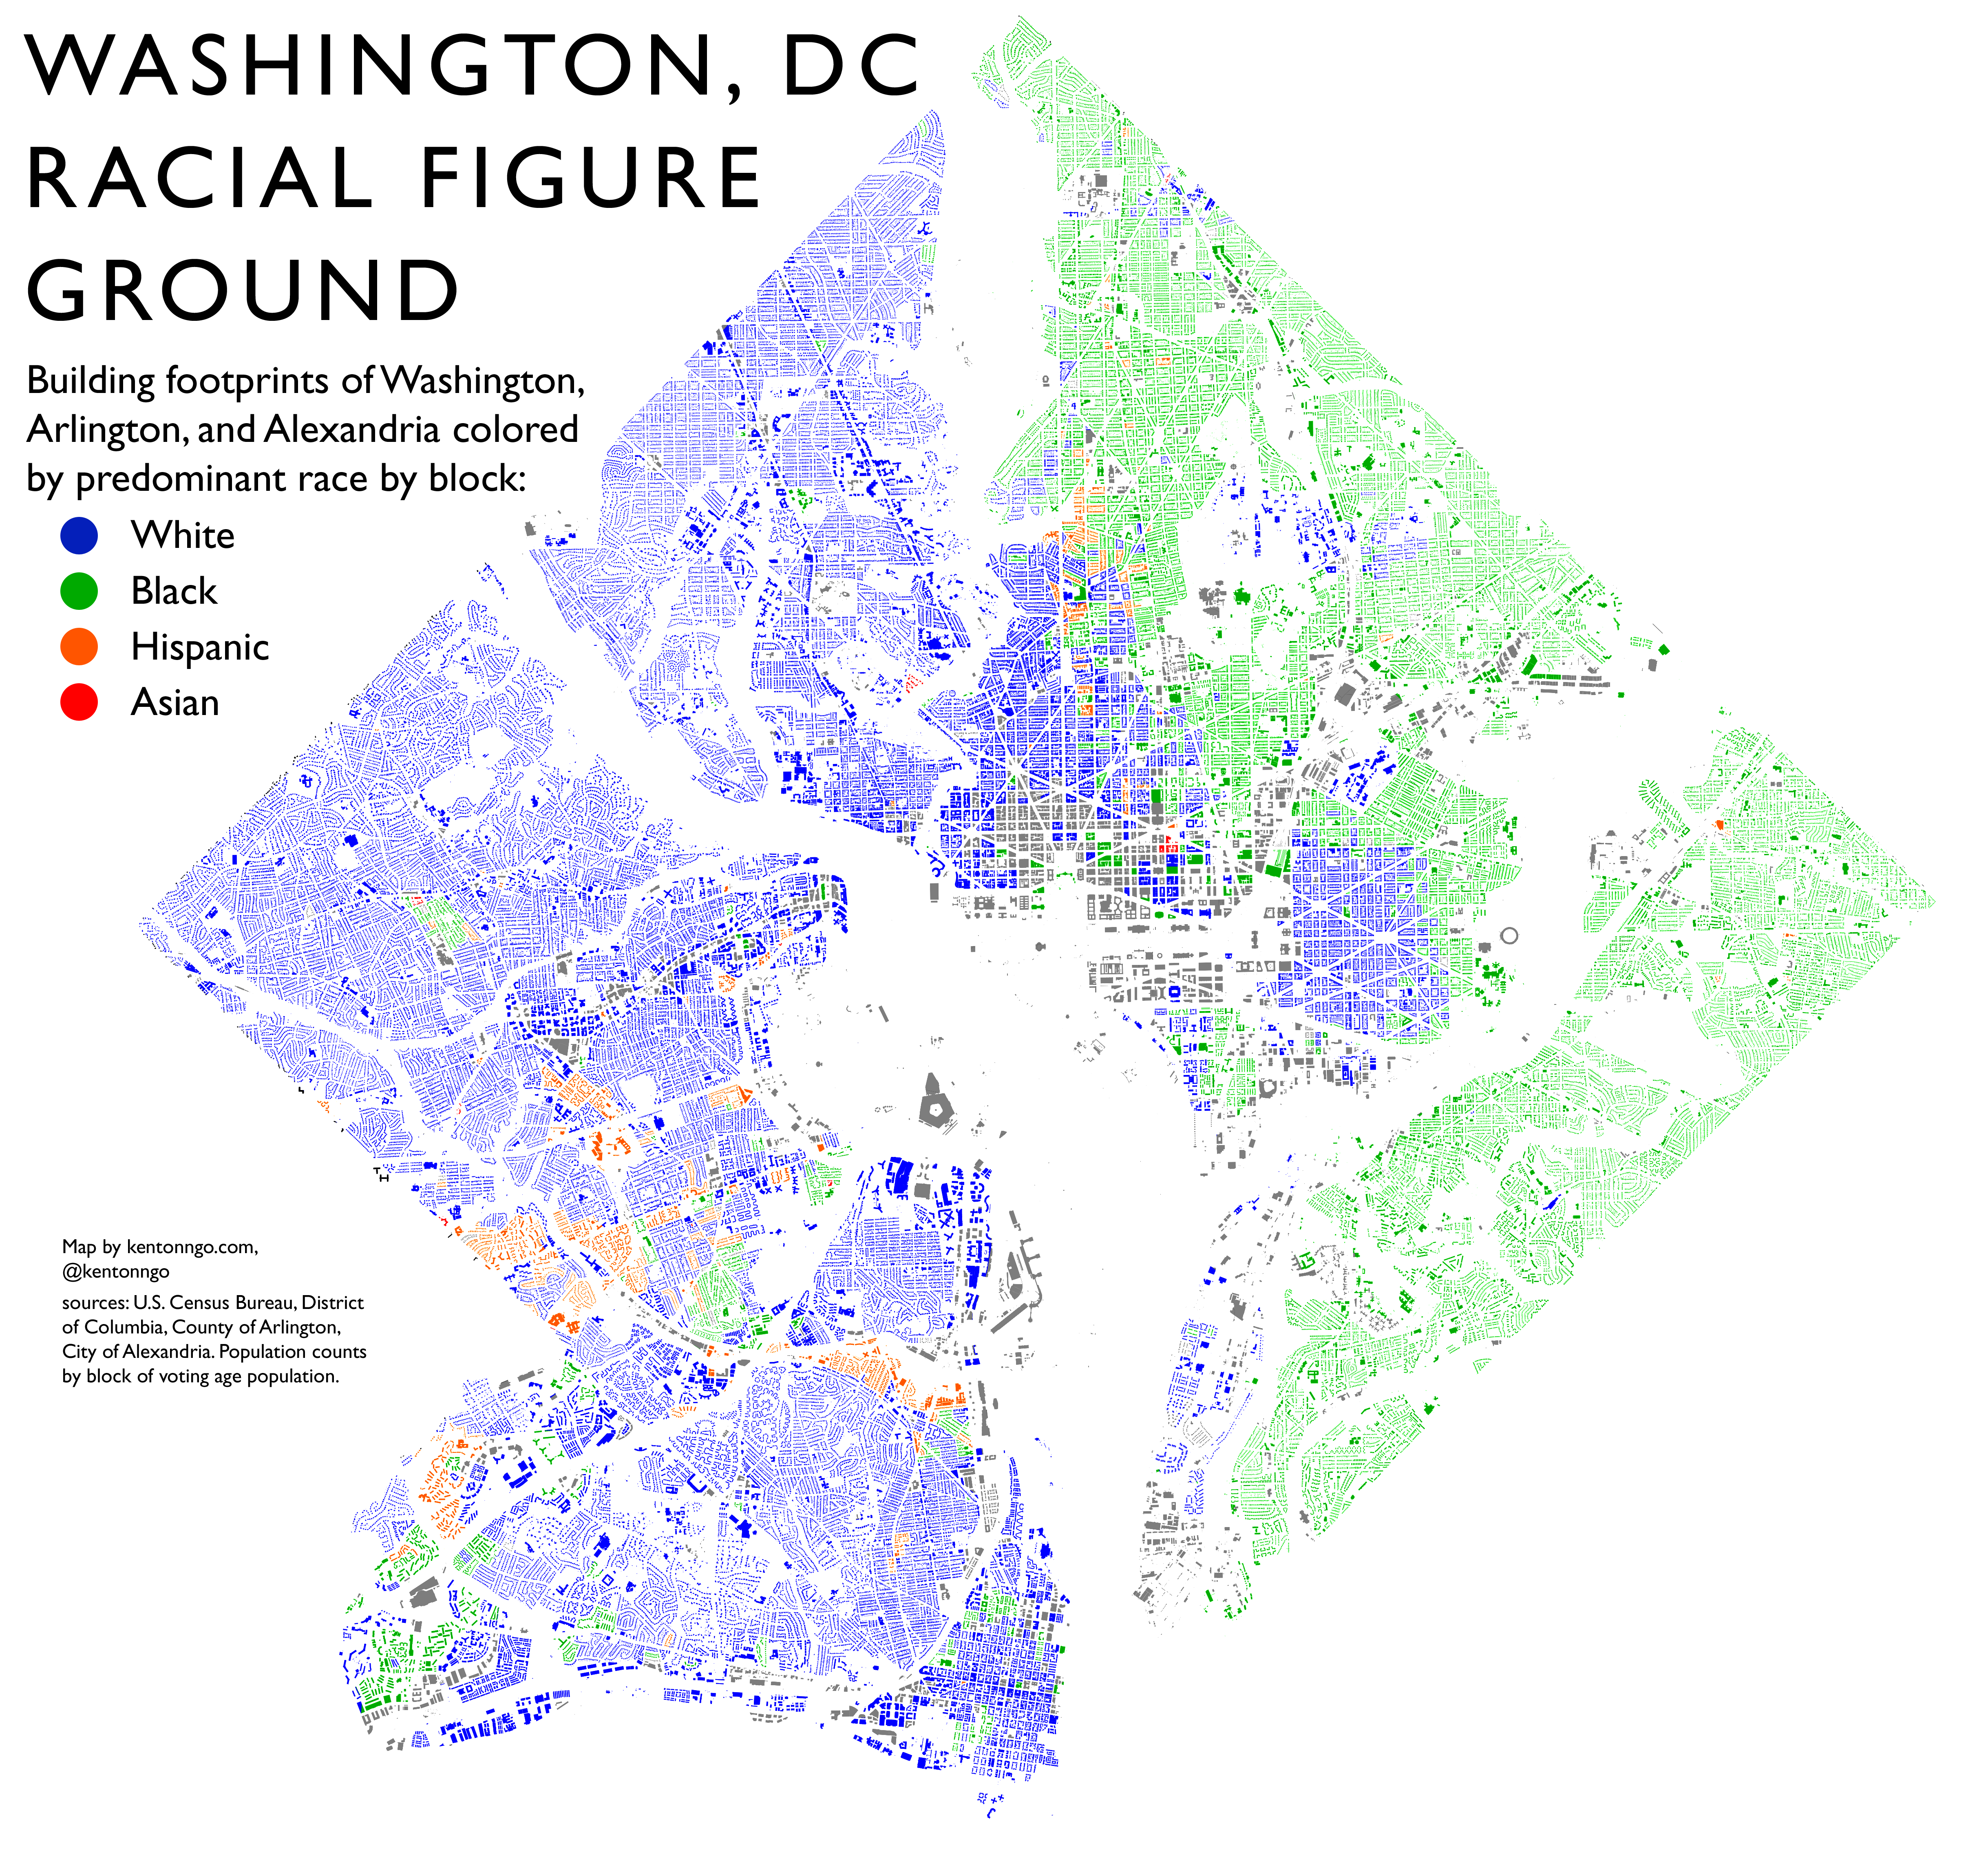
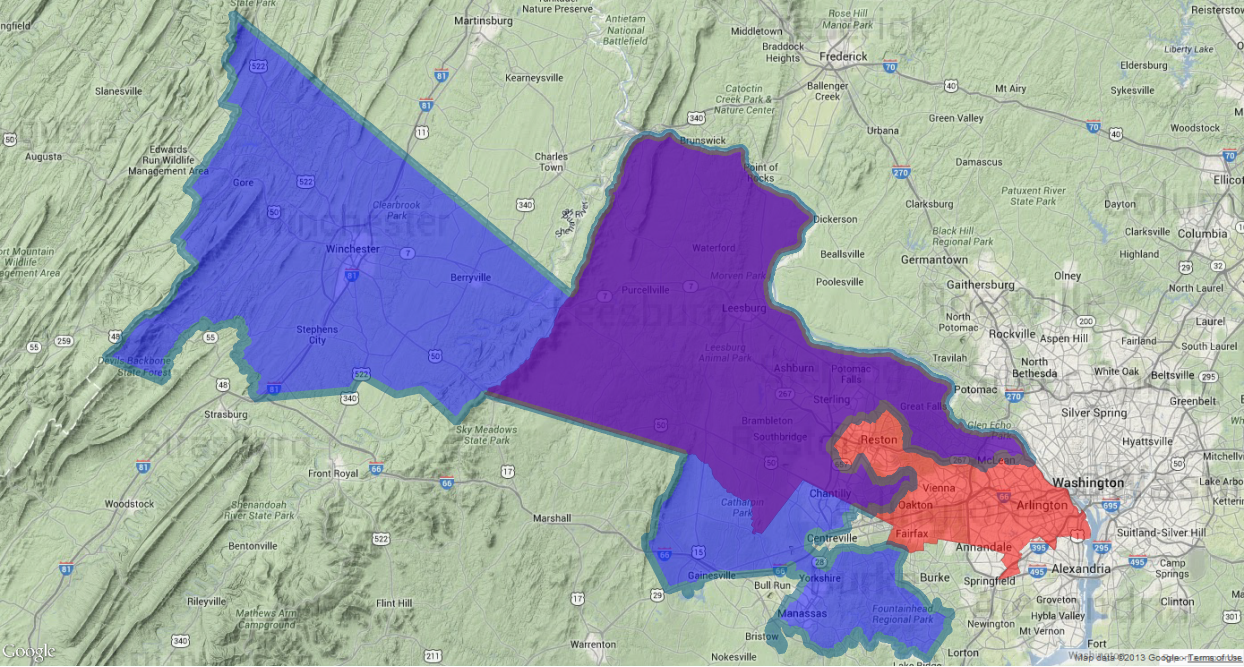
Virginia’s political future has long featured sharp differences between presidential years and off years. As rural strongholds of the FDR coalition are lost, Virginia Democrats are now almost exclusively reliant on strong minority turnout and fickle suburbanities. This strategy of running up the score in urban areas has kept Democrats in control of all 5 statewide offices (Governor, Lieutenant Governor, Attorney General, and both Senate seats) but leads to a structural disadvantage in downticket legislative elections. Thanks to this divide, Virginia can be considered a Democratic-leaning state in Presidential elections, with hollow success downticket.
Inefficiently packed in majority-minority and urban districts that are 60% or 70% Democratic, Democrats are forced to rely on increasingly difficult rural seats. Where you win doesn’t matter in statewide races, but it can tip the balance in single-member district legislatures.
Mark Warner was the last Democratic recruit of his kind, a Northern Virginian who could win big in Southwest Virginia. For Virginia Democrats, the future is bright for urban-based Democratic recruits who can run up the score in urban areas on the way to statewide victory. But as all victories in politics do, it comes with a tradeoff: as voters become better sorted in parties, Democrats in the countryside face increasingly long odds.

