Previous analysis here has shown that the Electoral College, small states are vastly overrepresented due to minimum seat thresholds and the mathematical properties of rounding off small quantities. The upcoming Florida Democratic Party election for state chair, for completely unnecessary reasons, has the exact same problems: overweighting of the smallest, most rural localities. Small numbers are the enemy of accurate representation: in addition to wreaking havoc in proportional systems like in Hong Kong’s LegCo (previously), it also causes trouble in weighted vote systems like the Florida Democratic Party’s, which I will use as an example here.
On January 26th, the Florida Democratic Party will elect a new chair in Lake Mary. It is widely believed that the race between Allison Tant of Tallahassee and Alan Clendenin of Tampa is going down to the wire. Representatives of the County Democratic Executive Committees who sit on the State Executive Committee will cast votes weighted by a formula that takes into account Democratic registration strength and performance. I don’t have a dog in this fight, but I have been watching this race as a Florida Democrat and as someone rather interested in voting systems. Because of a needlessly small multiplier in the weighting formula, the following absurdities will happen:
1) Lafayette County, a small county with only 3,102 registered Democrats, will wield 338% of the power it should.
2) Jackson County (17,880 registered Democrats) will cast the same number of votes as Lafayette despite deserving 643% more weight.
3) The 20 smallest counties should cast 19.58 weighted votes out of the total 1,022 statewide committee weighted votes, but will cast 40: over twice as much.
How is this possible? I’ll explain the basic mathematics behind small numbers of weighted votes breaking down into malapportionment, and offer a simple solution: increasing the multiplier ten times. This comes at no cost, since no extra people need to cast votes (as they are weighted), and is not much more computationally intensive (and we would expect in the 21st century that calculators or Microsoft Excel have hit the Florida Democrats!)
This analysis will focus only on the weighted votes of the county Democratic Executive Committee members, comprising about 89% of the total votes cast, and does not include the other members of the State Executive Committee: elected officials who are given special bonus votes by party bylaws, and automatic members as prescribed by Florida law. These members will cast around 11% of the total votes. This analysis also focuses only on the math, and does not take into account vacancies on the State Executive Committee. (Assume a spherical cow…)
Consider the formula for weighted vote allocation from Article 2, Section 5 of the State Party bylaws (PDF). The three components, highlighted for clarity: share of statewide Democratic registration; average share of the statewide Democratic vote in the last elections for President, Governor, and Senator; and the multiplier. The multiplier, highlighted in red, is the cause of this grief:

The output of this formula is then rounded to the nearest even number. Counties that are rounded down to 0 receive 2 votes anyway. This is similar to how in the Electoral College, Wyoming is less than 3/538ths of the population of the United States, but is mandated to receive 3/538ths of the Electoral College votes anyway. Let’s work through the two counties that receive the largest and smallest votes under this formula: Broward County in South Florida, and Lafayette County in the Panhandle.
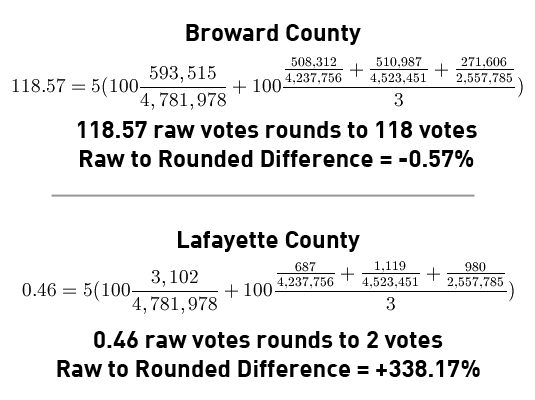
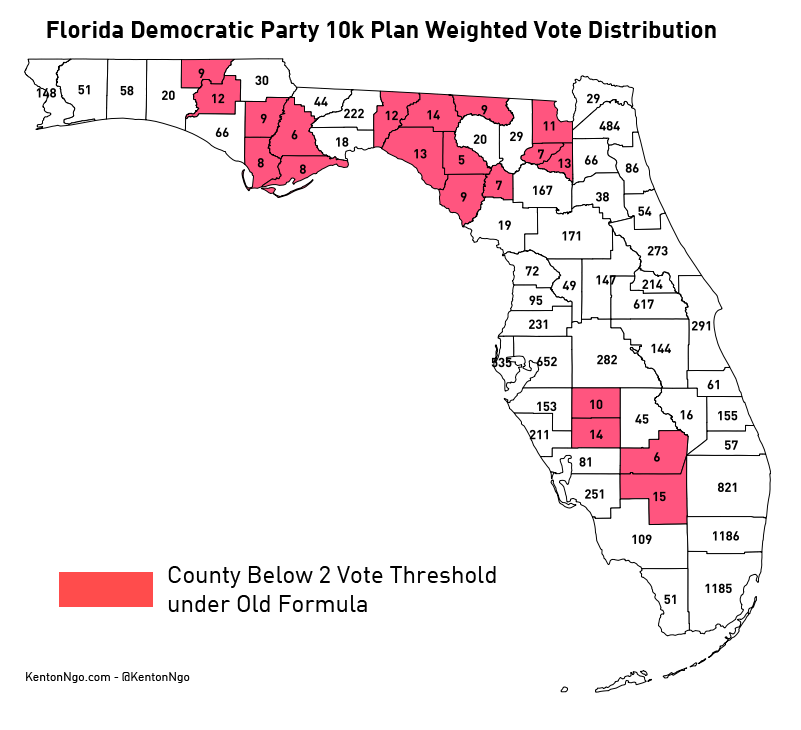
As you can see, the needlessly small multiplier of 5 gives Lafayette fewer votes than the minimum vote threshold. Once the 2 votes are given, its vote value soars 338%! Even worse, requiring that values be rounded to the nearest even number eliminates the possibility of giving Lafayette County a much closer vote value of 1. When this formula outputs very small quantities, the effects of rounding are absolutely enormous. This yields the following map of weighted vote allocations. Democratic elected officials also receive votes under the party bylaws as fixed percentage of statewide committee votes, which are also shown.
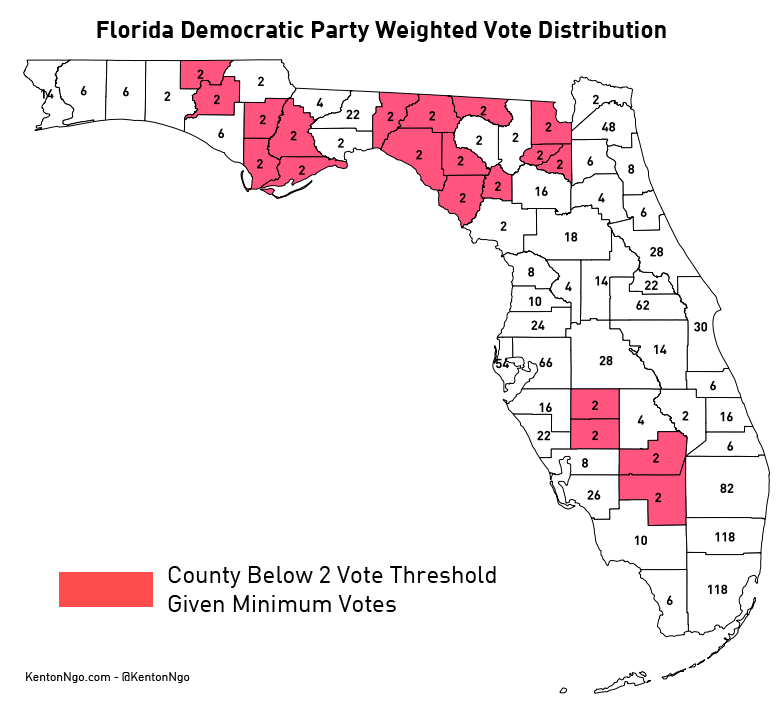
Highlighted in red are counties that do not round to the 2 vote threshold on their own, and are arbitrarily given the minimum 2 votes. Those 20 counties should round to either 0 or 1 votes. Combined, they should cast 19.58 votes, but instead receive 40 votes, more than double! Most of those counties are in the Panhandle, which can be considered to be a 20-vote free bonus to a Panhandle-based candidate if they vote as bloc, an unfair advantage in a close election brought on not by increased support among Democrats but by silly rounding problems. Fortunately, there is an extremely simple fix: increase the multiplier as below.

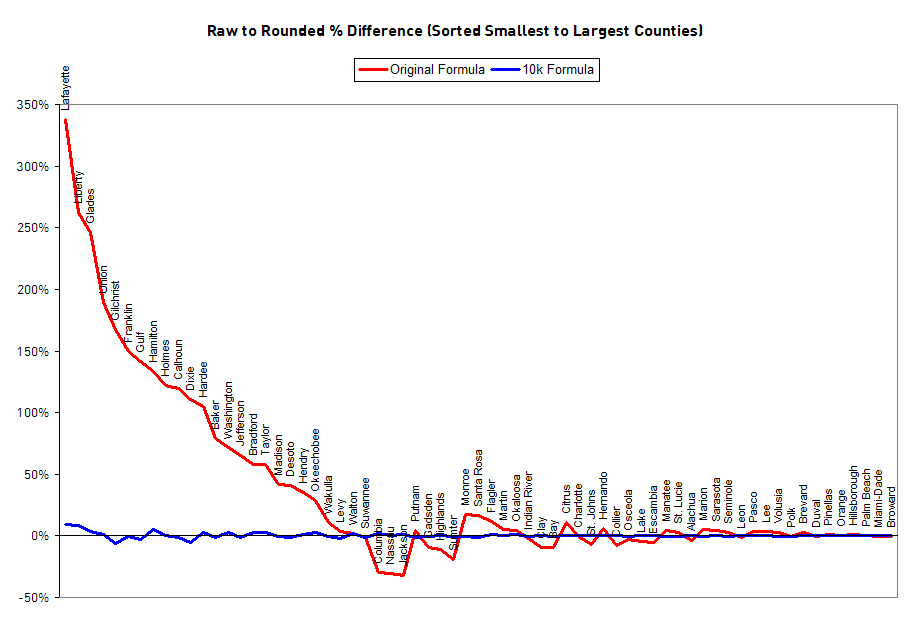
This yields 10,001 votes total distributed among county committees instead of 1,022, so we’ll call this formula the 10k Plan. Let’s also eliminate the requirement that votes be rounded to the nearest even number, and instead use the nearest whole number. (Even numbers are used in the original plan because each county’s votes are divided between its two state committeepeople. Are half-votes so hard to calculate? Republicans manage to do it.) The following chart shows the impact of rounding to the nearest whole number on counties sorted by their size: the percentage difference between their raw votes and their rounded votes. For the smallest counties, their impact under the old formula is doubled or tripled! As size increases, the relative effect of rounding reaches zero. Rounding effects using the new formula are drastically reduced.
Let’s redo the example of Broward and Lafayette Counties. As you can see, adding an extra 0 to the multiplier and eliminating even-only rounding results in a much more accurate distribution of weighted votes.
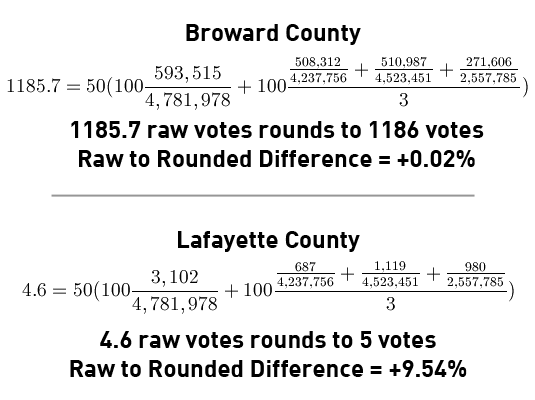
Finally, it yields the following map of weighted votes. Note how Jackson County now casts 30 votes and Lafayette County 5 votes, which reflects the magnitude of their size difference. Under the old plan they both cast 2 votes.
The Florida Democratic Party can come to decisions equally by using either apportionment (giving more populous localities more seats) or weighting (increasing the share of votes cast by populous localities without increasing the number of representatives). In a state as geographically large as Florida, weighting can be a sensible solution, but only if done in a manner that avoids this easy pitfall of a small multiplier. Since weighting obviates the need to recruit more committeemen or increase the size of the committee to an unmanageable size like apportionment would, the weighting multiplier can be increased infinitely without cost.
The spreadsheet with these calculations is embedded below for your perusal and analysis. Please contact me or comment below if you find errors or have suggestions.


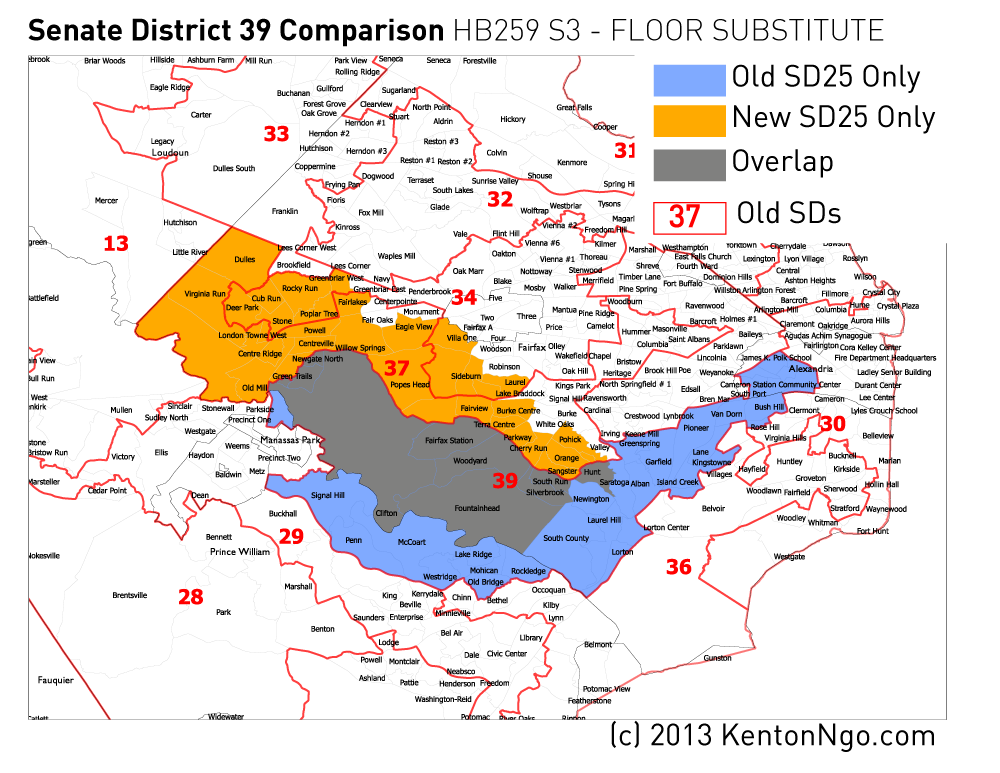
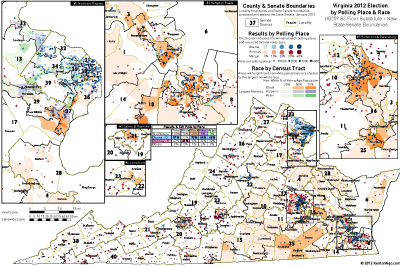 I have updated my previous visualization of 2012 polling-place returns in Virginia that showed a serious racial divide between diverse precincts and white precincts to include the mid-decade district lines rammed through the State Senate on Monday. See previous for comparison maps and old to new district redistribution figures.
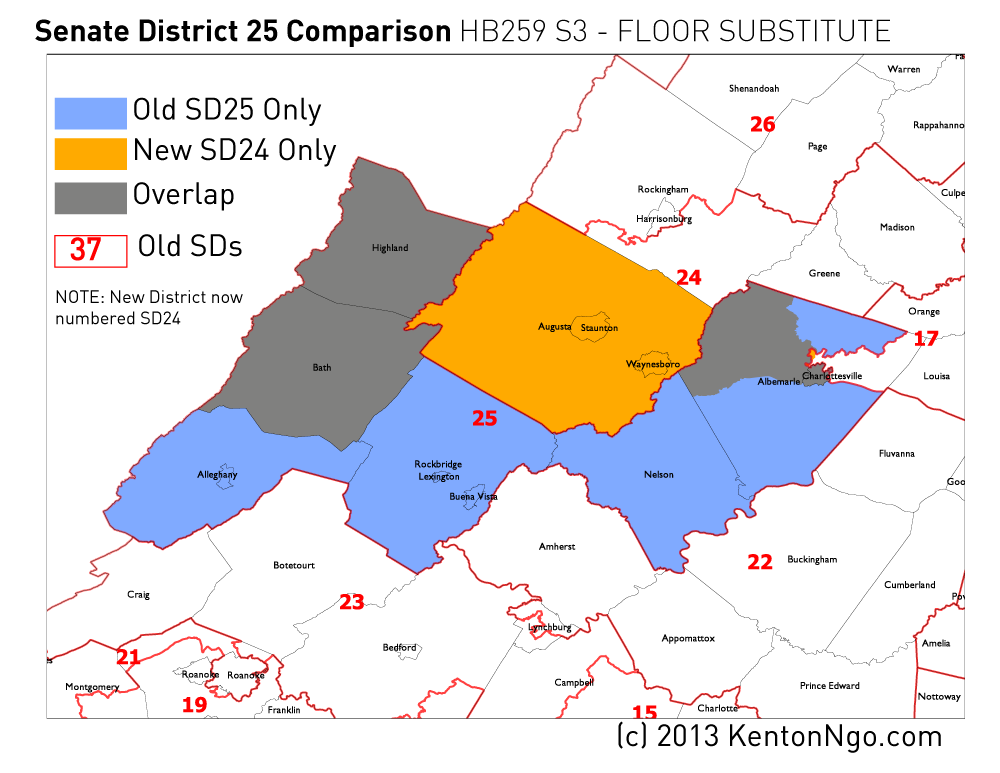


