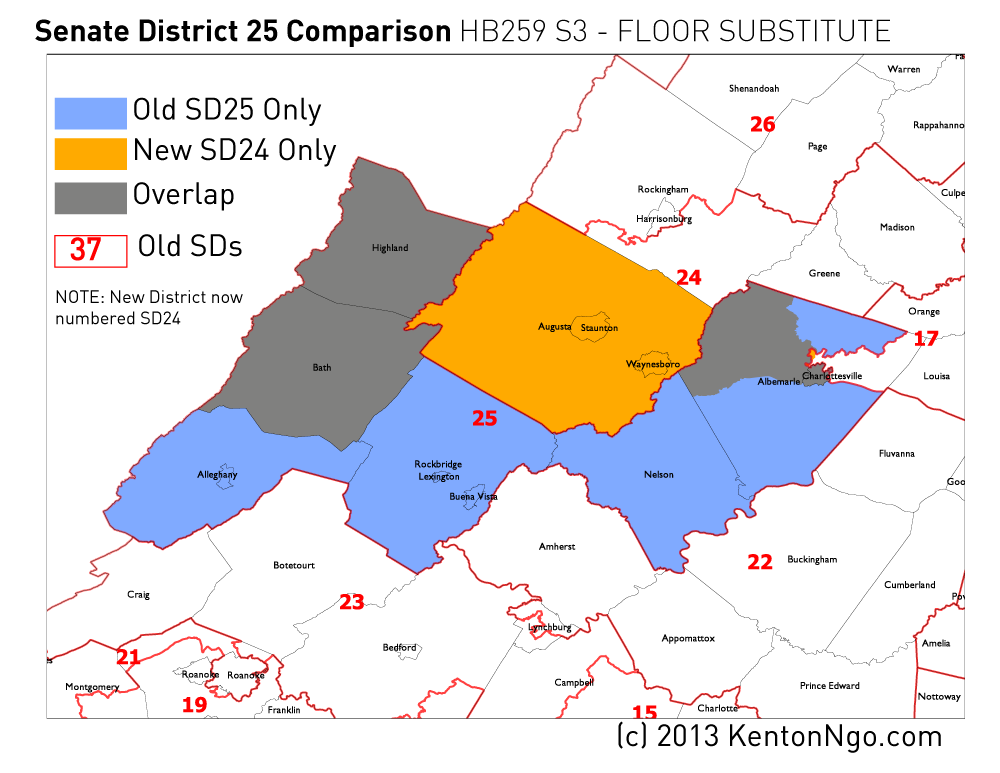
Using the bill provided by Not Larry Sabato I have been able to create some preliminary maps of the mid-decade redistricting currently before the House of Delegates, passed today by the State Senate.
First is State Senate District 25, where Democratic Sen. Creigh Deeds has been moved into a district containing heavily Republican Augusta County. (The new district and overlap turf is actually numbered 24 now, but it can be considered the “successor” to Deeds’ district.)
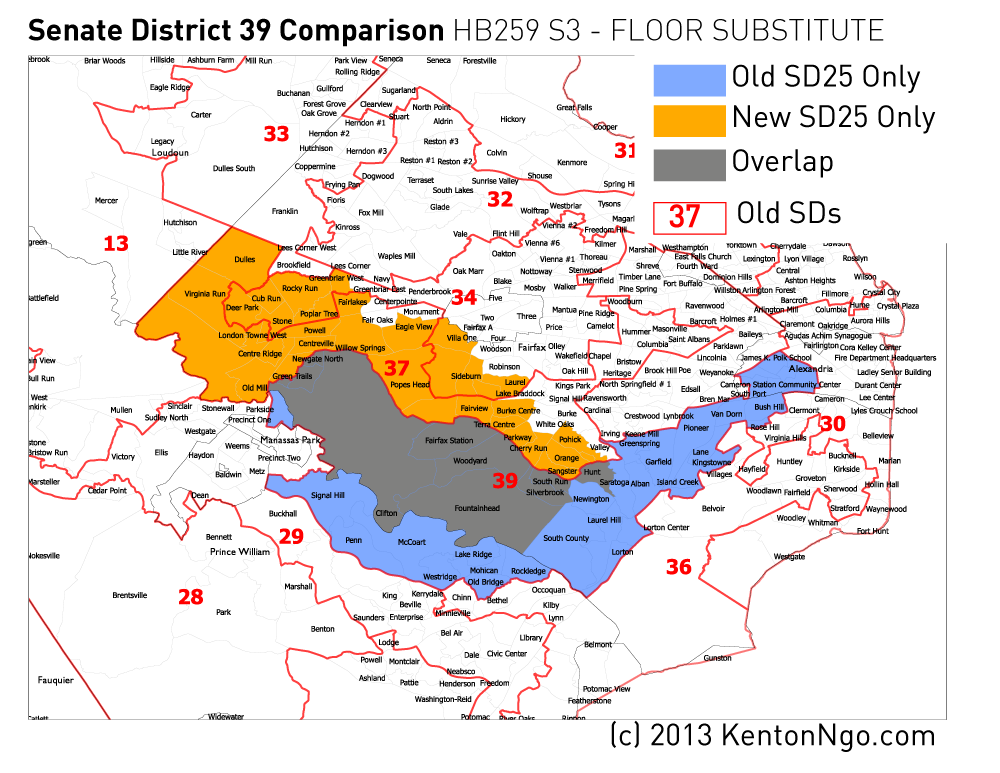
UPDATE 7:15PM: Also targeted is Senate District 39, where State Senator George Barker narrowly won a district stretching from Alexandria City through southern Fairfax County into Prince William County. Republicans traded heavily Democratic areas of Alexandria and Fairfax County and swapped them for more precarious turf previously in SD37. Clifton-based Barker picks up large sections of the communities of West Springfield, Centreville, and Chantilly.
UPDATE 7:35PM: Using official shapefile released by Virginia Division of Legislative Services, see this Google map of new districts. Click each district for information.
UPDATE 9:24PM: The following table shows the proportions of new State Senate Districts as proposed by the Senate Republicans by current State Senate district. Of the 6,147,347 voting age people in Virginia in Census 2010, 2,776,292 would be moved into a new district.
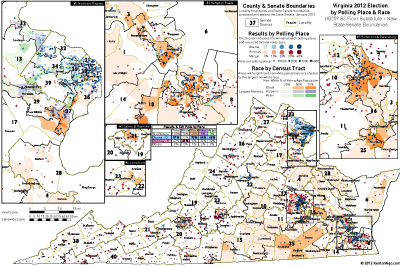
UPDATE JAN 22 5:45PM: See update for precinct-level map of 2012 returns with race data that clearly shows the racial geography that informed creation of new VRA-compliant districts. Click below for full-size version.
Previous analysis here has shown that the Electoral College, small states are vastly overrepresented due to minimum seat thresholds and the mathematical properties of rounding off small quantities. The upcoming Florida Democratic Party election for state chair, for completely unnecessary reasons, has the exact same problems: overweighting of the smallest, most rural localities. Small numbers are the enemy of accurate representation: in addition to wreaking havoc in proportional systems like in Hong Kong’s LegCo (previously), it also causes trouble in weighted vote systems like the Florida Democratic Party’s, which I will use as an example here.
On January 26th, the Florida Democratic Party will elect a new chair in Lake Mary. It is widely believed that the race between Allison Tant of Tallahassee and Alan Clendenin of Tampa is going down to the wire. Representatives of the County Democratic Executive Committees who sit on the State Executive Committee will cast votes weighted by a formula that takes into account Democratic registration strength and performance. I don’t have a dog in this fight, but I have been watching this race as a Florida Democrat and as someone rather interested in voting systems. Because of a needlessly small multiplier in the weighting formula, the following absurdities will happen:
1) Lafayette County, a small county with only 3,102 registered Democrats, will wield 338% of the power it should.
2) Jackson County (17,880 registered Democrats) will cast the same number of votes as Lafayette despite deserving 643% more weight.
3) The 20 smallest counties should cast 19.58 weighted votes out of the total 1,022 statewide committee weighted votes, but will cast 40: over twice as much.
How is this possible? I’ll explain the basic mathematics behind small numbers of weighted votes breaking down into malapportionment, and offer a simple solution: increasing the multiplier ten times. This comes at no cost, since no extra people need to cast votes (as they are weighted), and is not much more computationally intensive (and we would expect in the 21st century that calculators or Microsoft Excel have hit the Florida Democrats!)
This analysis will focus only on the weighted votes of the county Democratic Executive Committee members, comprising about 89% of the total votes cast, and does not include the other members of the State Executive Committee: elected officials who are given special bonus votes by party bylaws, and automatic members as prescribed by Florida law. These members will cast around 11% of the total votes. This analysis also focuses only on the math, and does not take into account vacancies on the State Executive Committee. (Assume a spherical cow…)
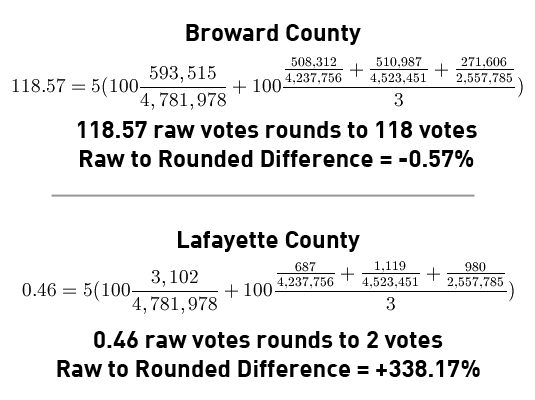
Consider the formula for weighted vote allocation from Article 2, Section 5 of the State Party bylaws (PDF). The three components, highlighted for clarity: share of statewide Democratic registration; average share of the statewide Democratic vote in the last elections for President, Governor, and Senator; and the multiplier. The multiplier, highlighted in red, is the cause of this grief:
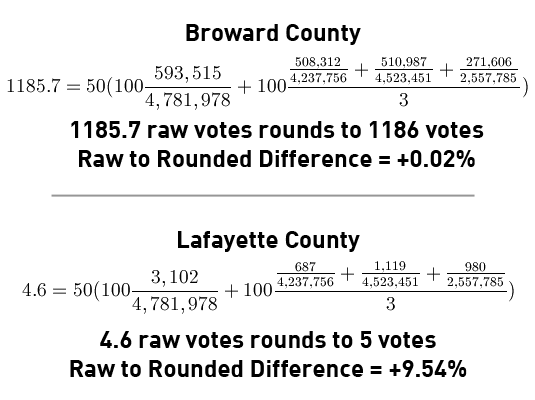
The output of this formula is then rounded to the nearest even number. Counties that are rounded down to 0 receive 2 votes anyway. This is similar to how in the Electoral College, Wyoming is less than 3/538ths of the population of the United States, but is mandated to receive 3/538ths of the Electoral College votes anyway. Let’s work through the two counties that receive the largest and smallest votes under this formula: Broward County in South Florida, and Lafayette County in the Panhandle.
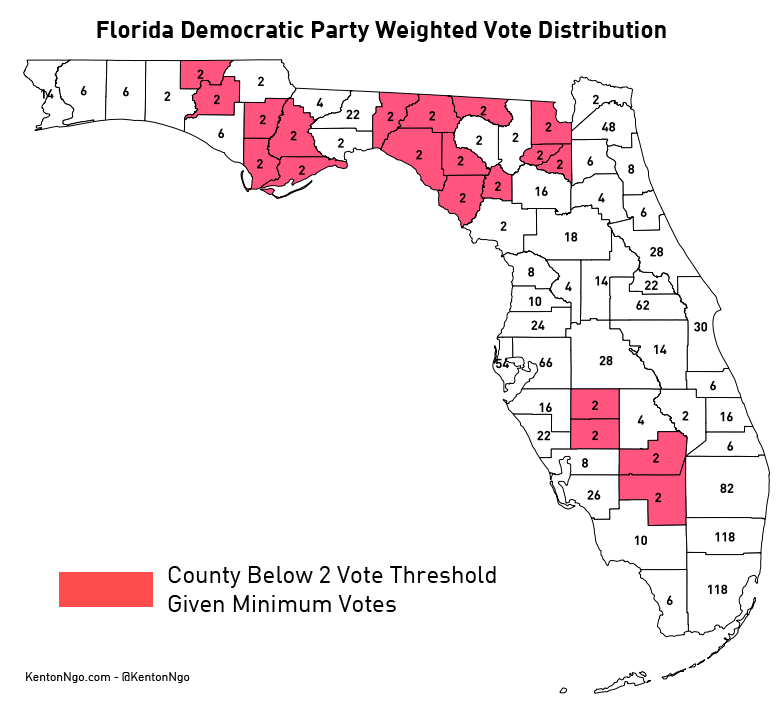
As you can see, the needlessly small multiplier of 5 gives Lafayette fewer votes than the minimum vote threshold. Once the 2 votes are given, its vote value soars 338%! Even worse, requiring that values be rounded to the nearest even number eliminates the possibility of giving Lafayette County a much closer vote value of 1. When this formula outputs very small quantities, the effects of rounding are absolutely enormous. This yields the following map of weighted vote allocations. Democratic elected officials also receive votes under the party bylaws as fixed percentage of statewide committee votes, which are also shown.
Highlighted in red are counties that do not round to the 2 vote threshold on their own, and are arbitrarily given the minimum 2 votes. Those 20 counties should round to either 0 or 1 votes. Combined, they should cast 19.58 votes, but instead receive 40 votes, more than double! Most of those counties are in the Panhandle, which can be considered to be a 20-vote free bonus to a Panhandle-based candidate if they vote as bloc, an unfair advantage in a close election brought on not by increased support among Democrats but by silly rounding problems. Fortunately, there is an extremely simple fix: increase the multiplier as below.
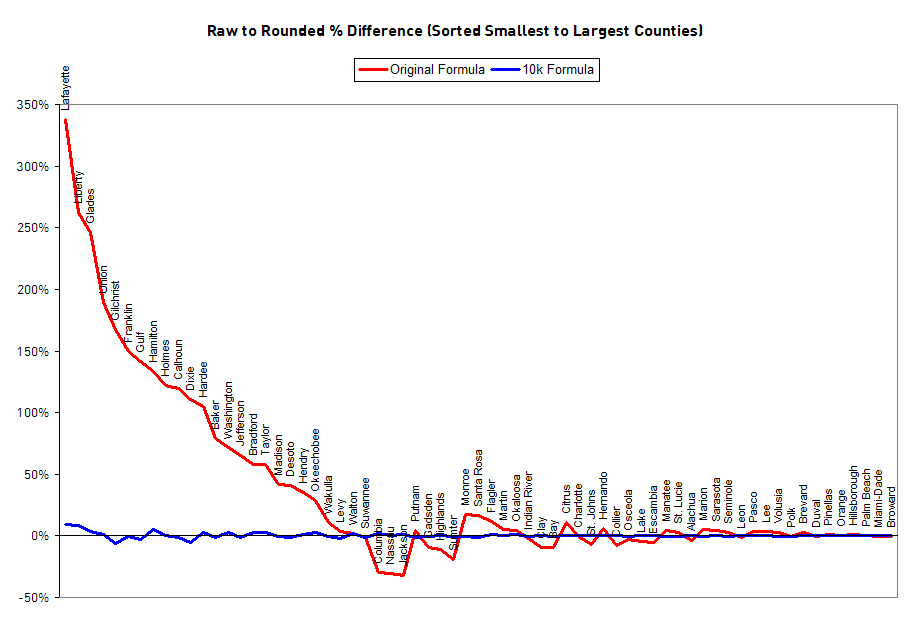
This yields 10,001 votes total distributed among county committees instead of 1,022, so we’ll call this formula the 10k Plan. Let’s also eliminate the requirement that votes be rounded to the nearest even number, and instead use the nearest whole number. (Even numbers are used in the original plan because each county’s votes are divided between its two state committeepeople. Are half-votes so hard to calculate? Republicans manage to do it.) The following chart shows the impact of rounding to the nearest whole number on counties sorted by their size: the percentage difference between their raw votes and their rounded votes. For the smallest counties, their impact under the old formula is doubled or tripled! As size increases, the relative effect of rounding reaches zero. Rounding effects using the new formula are drastically reduced.
Let’s redo the example of Broward and Lafayette Counties. As you can see, adding an extra 0 to the multiplier and eliminating even-only rounding results in a much more accurate distribution of weighted votes.
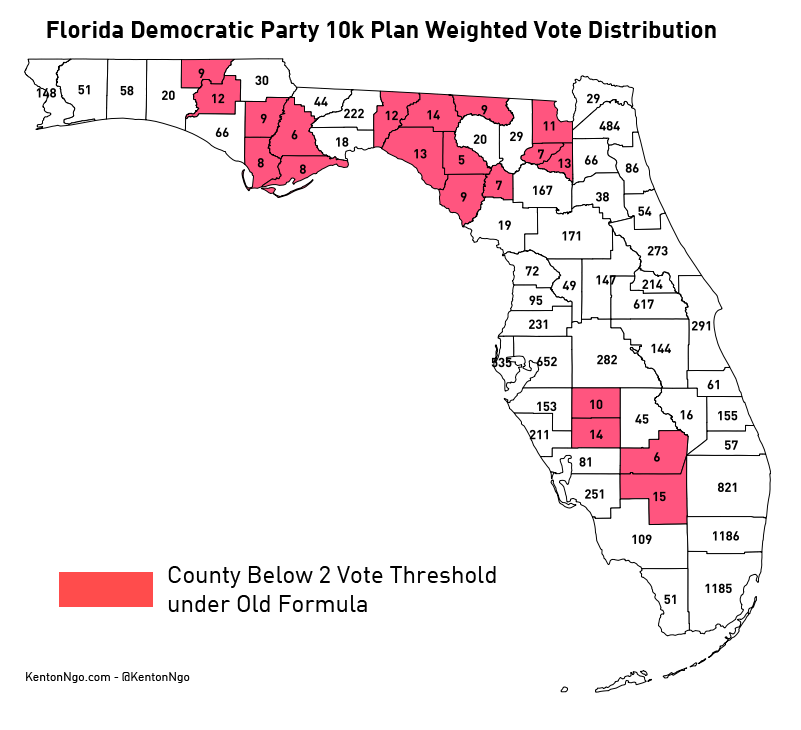
Finally, it yields the following map of weighted votes. Note how Jackson County now casts 30 votes and Lafayette County 5 votes, which reflects the magnitude of their size difference. Under the old plan they both cast 2 votes.
The Florida Democratic Party can come to decisions equally by using either apportionment (giving more populous localities more seats) or weighting (increasing the share of votes cast by populous localities without increasing the number of representatives). In a state as geographically large as Florida, weighting can be a sensible solution, but only if done in a manner that avoids this easy pitfall of a small multiplier. Since weighting obviates the need to recruit more committeemen or increase the size of the committee to an unmanageable size like apportionment would, the weighting multiplier can be increased infinitely without cost.
The spreadsheet with these calculations is embedded below for your perusal and analysis. Please contact me or comment below if you find errors or have suggestions.
Tropical Storm Debby gives my apartment a waterfront view.
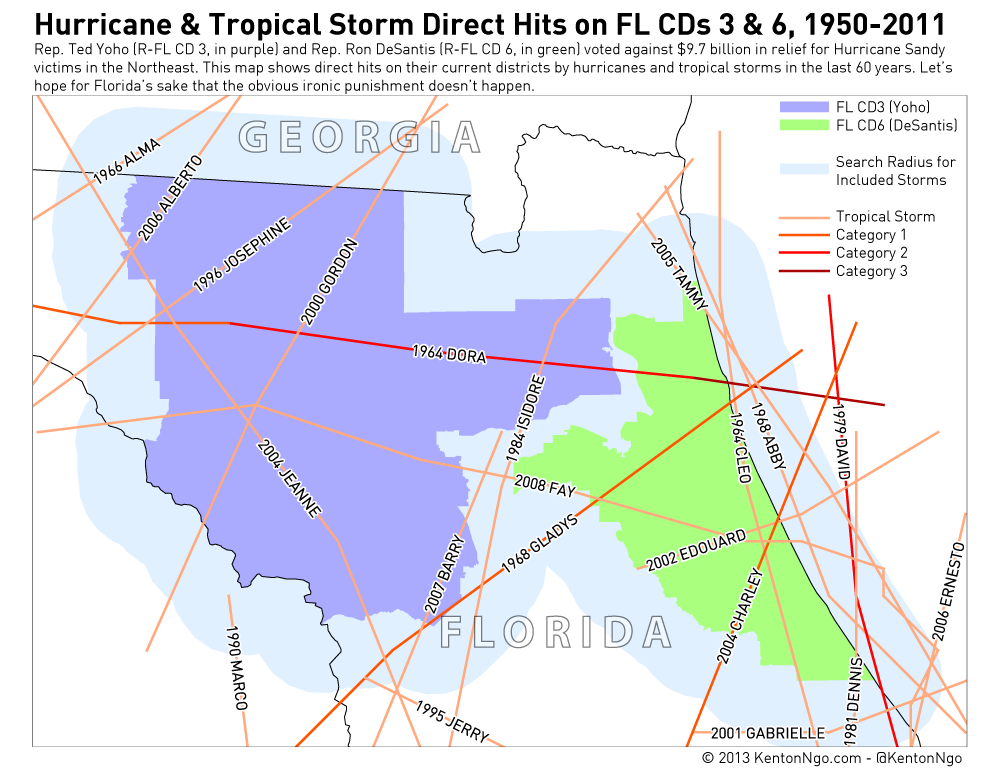
Last week, after furious protest from New York City area Republicans, House Speaker John Boehner allowed $9.7 billion in Hurricane Sandy relief to pass the House of Representatives on a suspension vote. Among the 67 that voted no were two newly-elected ultraconservative Republicans: Rep. Ted Yoho and Rep. Ron DeSantis, both of whom represent coastal districts in North Florida.
That’s one hell of a brazen commitment to “principle” coming from two Congressmen that represent hurricane-friendly turf! Below, I’ve mapped historic hurricane tracks over territory that is now represented by our Tea Party twins. Let’s hope that the rest of America’s members of Congress are forgiving when (not if) North Florida gets whacked with another hurricane and needs a relief bill. The gods of ironic punishment have plenty to work with!
The below map shows only direct hits by the storm centers. Hurricanes and tropical storms are massive systems that have effects hundreds of miles from the core, so this is only a sampling of the destruction that storms like Sandy have wrought on Yoho and Desantis’s North Florida districts. TS Debby’s track, which produced the flood of my apartment complex above, is not yet in the IBTrACS database I sourced the hurricane data from.
UPDATE! I have 3 24″x36″ prints left of the map below for sale for $39 each plus shipping. They’re full color, union printed, and ready to grace your wall. Use the secure PayPal link below to order.
It’s well-known by now that Barack Obama’s strong support among a growing set of people of color propelled him to victory over Mitt Romney’s white-dependent coalition. Few states have shown this more than Virginia, where exit polls show Obama won the state carrying only 37% of the white vote. I have prepared the map below which overlays polling place-level election results on top of Census non-white percentage.
Areas are shaded by their total non-white percentage and also whether those areas were more ▰ Black (orange), ▰ Hispanic (purple), or ▰ Asian (green). ● Blue dots showing Democratic precincts cluster in diverse areas, growing more intense as nonwhite population increases, while ● red dots showing Republican precincts correlate tightly to white areas.
Racial divisons are especially profound in Hampton Roads and Richmond, where racial politics are still largely a two-dimensional Black and White game. Notice city pairs such as black Petersburg and white Colonial Heights, which are separated by a river and are at polar opposites in politics. In Northern Virginia, Black voters are eclipsed in population by Hispanic and Asian voters, which voted heavily Democratic, but not at the near-unanimous level of Black voters. In the western part of the state, where voters are often overwhelmingly white, red dots are dominant outside of college towns. Outside of well-discussed urban cores were rural areas in Southside Virginia that have a significant Black population.
This map was heavily inspired by Bill Rankin’s dot-density maps of regional race and the New York Times’ size-dot precinct map of New York City. Trying to show race and political data at the same time can be a difficult task, but I find that the pointillist view of using individual dots for precincts on top of a colored race layer is a good way to show its complexity.
The full size version is after the jump. Read More »
On December 19, 2012, South Korean voters elected Park Geun-hye of the ruling Saenuri party to a five-year term as president, defeating Democratic United Party nominee Moon Jae-In. Park defeated Moon by a narrow 51.6% to 48.0%. Moon Jae-in won the southwestern Jeolla region by over 70 percentage points and a smaller margin in the capital city of Seoul, but these crushing margins were not enough to overcome Saenuri margins in the rest of the country.
Below is an interactive map I prepared showing province-level returns and margins. Mouseover a province on the map to highlight its position in the chart, or click a row in the data table to select its corresponding province on the map. The data table is also sortable.
For Virginia’s Lieutenant Governor Bill Bolling and Florida’s former Governor Charlie Crist, Republicans who were blocked from higher office from within their own party, their political destiny hangs on a momentous decision in this winter of 2012: whether to sever their lifelong loyalties to the Republican Party. They need a mixture of two elements to succeed, only one of which they can control: opportunism and party realignment.
By default, party switchers appear spineless. Over time, party switchers have performed less well even if they are re-elected under their new party banner. However, if the voters and parties are rearranging themselves as fast as the politicians are, they are more forgiving. Thus the contrast between Mills Godwin, the only man to be elected Governor of Virginia as both a Democrat in 1965 and Republican in 1973 at a time when Virginia political parties were reshuffling, and the losers. Sen. Arlen Specter, Rep. Parker Griffith: two men who switched after being elected by their original parties at a time of political party stability, and were punished by their new party in primaries.
Of Bolling and Crist, Charlie Crist stands a much better chance of following in Godwin’s footsteps (in reverse), but the path is more difficult for both. There has been no similar massive change in the party coalitions in either Virginia or Florida in the last decade, making it harder for both of them to break the system open.
For both, Virginia’s chaotic three-way gubernatorial election of 1965 is a historical parable that, like most historical parables, is of debatable applicability but is undeniably fascinating. That year, Mills Godwin, a conservative Democrat, defeated Republican nominee Linwood Holton and segregationist splinter candidate William J. Story, who broke ranks from the Democratic Party. Godwin won decisively with 48%, to Holton’s 38% and Story’s 13%.
Crist, who was elected Governor previously as a Republican and is now out one term cannot escape at least a passing comparison to Godwin, who won the 1965 election as a Democrat, served his term, and was elected again as a Republican in 1973. For Bolling, the splintering of the conservative Byrd Organization in the 1965 election between Godwin and Story hangs as a ghost over any Independent bid that would split the conservative Republican Party between Bolling and Attorney General Ken Cuccinelli. This is not to say that either Bolling or Cuccinelli are segregationist, nothing could be further from the truth: the point is that intra-conservative fighting spilling over into independent challenges is nothing new in Virginia.
Throughout the mid 20th century, Virginia was dominated by a conservative, white Democratic machine led by Senator Harry Byrd: the fabled and feared Byrd Organization that owned state offices but remained silent on presidential races. In 1965, Mills Godwin was elected its last governor as a Democrat.
An ardent segregationist who believed in Massive Resistance, he switched sides ahead of the 1964 Presidential election, supporting Lyndon Johnson. 1964 was the first election without a poll tax, and black and poor white voters gave Johnson Virginia’s 12 electoral votes, the only Democrat to carry the Commonwealth between Truman ’48 and Obama ’08. Barry Goldwater’s extreme, anti-civil rights stances sent the African-American vote running from the party of Lincoln to the party of Johnson, and Godwin worked hard to court their vote.
The Goldwater backlash was not limited to African-Americans. Virginia Republicans nominated Linwood Holton, a moderate from Roanoke, to hopefully make a good showing against Godwin.
The unraveling of the Byrd Organization gave the Republican Party a chance to be a real second party for the first time in decades. Their tacit agreement to support Byrd Democrats (as profiled to the right in a 1965 Washington Post clip) was giving way to the chance that one of their own might win, but the Goldwater candidacy had alienated many moderates within the Republican Party. This intra-conservative squabbling led to less support for Holton and chaos on the right.
Party switching is far more common in fluid parliamentary systems that use proportional representation than America’s first-past-the-post approach that causes a rigid two-party structure to be the norm. In such a system, it takes extraordinary forces to cause politicians to switch parties, and even greater extraordinary forces for apostates to succeed afterwards: but for some, it is the only way forward. It takes some principled opportunism, a crass mixture of severing lifelong loyalties, poisoning friendships, raw ambition, and fervent belief in one’s own destiny and the correctness of their principles: this is the element the party switcher can control.
What the switcher can’t control is the second element, party realignment. The parties must change around the politician just as much as the politician changes himself. It takes seismic, cataclysmic shifts to pulverize the bedrock bases of both parties and recast this amalgam and debris into two new parties. Party switchers and leavers will frequently assert that they didn’t leave the party, the party left them: but whether this is true is not up to them.
So what does that say for Crist and Bolling? Both men certainly have the first part, no man who wasn’t filled with ambition would even contemplate such a move. The environment of 1965, with national partisans and state partisans in conflict, and state partisans in mortal combat with themselves, was a chaotic era of party realignment that lent itself well to ambitious party switchers. What voter could punish for disloyalty when he himself was redefining his partisanship? Regardless, 1965 was the end of the line for the Byrd Organization. Virginia has a one-term limit for its governors, and in 1969, Mills Godwin was succeeded by Linwood Holton, the man he defeated, the first Republican governor of Virginia since Reconstruction.
For Bolling’s gambit to succeed in a 3-way race, he would have to convince Virginia liberal Republicans to flee Cuccinelli like conservative Democrats fled Howell. But this pretends that there are any liberal Republicans left in Virginia, and also requires that the ideological changes in the Democratic and Republican parties were as tumultuous as they were in the late 60s and early 70s. Bolling can’t simply join the Democratic Party and try to make it a two-way race because both parties are largely the same as they were in 2005 when Bolling was elected Lieutenant Governor. No major seismic shift has happened, and Democrats would never let him past a primary.
One faction missing from the 1965 election were the populist liberals, who were corralled into Godwin’s corner. The Goldwater implosion of 1964 which pummeled Virginia Republicans was followed by the McGovern debacle of 1972 which shattered Virginia Democrats. Howlin’ Henry Howell, who once opined that “a liberal in Virginia is someone who believes in life after death”, was a fiery opponent of the fiscally tightfisted, socially reactionary Byrd Organization. Charging at the dying Organization from the left, he lost the 1969 Democratic primary for Governor, but after the death of Lieutenant Governor J. Sargent Reynolds in 1971, was elected Lieutenant Governor and seized the Democratic nod in 1973.
Howell and Scott are about as far away from each other ideologically as one could be, but they shared a fair distance from the center. Conservative Democrats, horrified by the McGovern nomination in 1972 and equally as appalled by Howell’s nomination in 1973, began bolting to the Republican Party and convinced Godwin to return as Republican nominee in 1973. Godwin was nominated without opposition at the 1973 Republican Convention: a party switcher who faced nary a primary challenger! Such was the power of realignment and a well-known name. In November, Godwin won 51-49 in one of the closest gubernatorial elections in Virginia history.
Bolling can’t walk into Democratic arms like Godwin walked into Republican arms, so he’s left with this quixotic independent option. If Bolling entered the Democratic primary for 2013, he’d be laughed out of the ballot box, a marked contrast to the 1973 Republicans. While it worked for candidates like Lincoln Chafee, elected Senator for Rhode Island as a Republican, defeated, and then elected as an independent for Governor, Bolling is no Chafee (or Angus King). Bill Bolling has been lieutenant governor for nearly eight years, and most Virginians can’t pick him out of a lineup or think of a single thing he’s done. Chafee and King were institutions.
For Crist, however, his chances depend on a primary. Can he really count on Florida Republicans changing their minds about Scott like conservative Democrats decried Howell? Most likely not. He already tried running an independent in a three-way race and lost big in 2010 to Marco Rubio. Democratic nominee Kendrick Meek captured the black vote, leaving Crist fighting for the remaining part of the Democratic coalition and whatever scraps of the rest of the electorate he could.
Knowing that no matter what happens, the black vote would remain straight-ticket Democratic, he knew his only option was to run as full-blown Democrat. Unfortunately for him, there has been no influx of disgruntled Republicans disgusted with Rick Scott that will take over the 2014 Florida Democratic Primary for him. Many of the Democratic primary voters who vigorously opposed him in past elections are still there, and may not be persuaded to change their minds.
Like Bolling, Crist will not walk into the Democratic field easily. If there has been any realignment at all, it’s been in the opposite direction Crist would want it to be: conservative Democrats, especially in the Panhandle, dying off or converting to Republican, leaving a more liberal, more partisan primary electorate in its wake. Even worse for Crist, Florida is a closed primary state. However, as someone with much higher name recognition who has spent over two years working on his Democratic bona fides, he stands a higher chance of being perceived as a sincere party switcher. Absent a cataclysmic party realignment though, he’s asking the same group of people that repeatedly tried to end his career to embrace him. This was a death blow for Arlen Specter, a Republican-turned-Democrat who was defeated in a primary by a partisan, registered Democratic electorate in 2010.
The stability and continued entrenchment of the current party system works against both Crist and Bolling. Mills Godwin and many other successful party switchers like Sen. Richard Shelby of Alabama avoided primary challengers from their adopted parties because the primary electorates changed as fast as they did. For Bolling, I don’t see any real options for him. He can’t win a Democratic primary. He can’t run as an Independent and win. What’s left for him?
For Crist, though, he has a way to survive a hostile, closed primary. Sure, the Democratic primary electorate is not radically different from the Democratic primary electorates that salivated at the chance to kick him out of office. What he needs is an empty bench of potential primary challengers: and in that respect, as of now, he’s quite lucky. But there’s still a long ways to go.
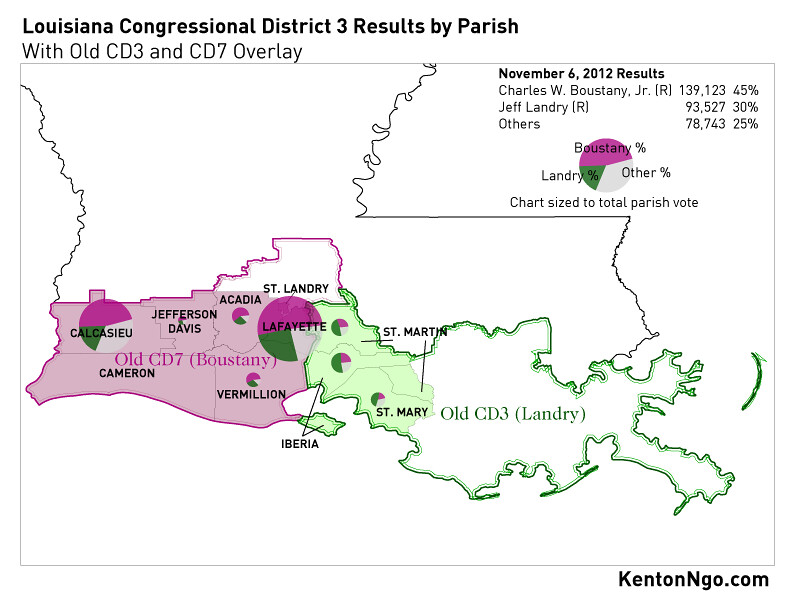
For inveterate political junkies watching tonight’s all-Republican runoff in Louisiana’s 3rd District, the last member-member race of the year, I’ve prepared this quick map showing the old CD03 (Rep. Jeff Landry) and CD07 (Rep. Charles Boustany) laid over new CD03 results from November. As you can see, the largest parishes of the new district are in Boustany’s old district (Lafayette and Calcasieu Parishes), and that every county voted for their incumbent. Similarly strong geographic splits were mapped in Pennsylvania’s member-member races earlier this year.
P.S. – I take custom commissions for county & precinct election maps. Want one hanging on your wall? Click here.


